
About
What are the Tithe Records?
Tithe maps and schedules were created by the government in a massive survey of all of the parishes of England and Wales that were still subject to tithes between 1836 and the early 1850s. The records were originally collected so that an end could be made to an outdated tax on agricultural produce that had required a tenth of any profit made from crops, livestock, eggs and milk being payable to the established church and also to some lay people who had obtained the rights to the tithes which had previously been payable to the monasteries dissolved in the reformation. While in 1836 not all the country was subject to paying tithes, the majority of England and Wales still was at this time.
How tithe maps and apportionment books can help with your research
If you can find a tithe record, in which an ancestor’s name appears, then you will be able to see a description of the land they owned or occupied. By viewing the linked tithe map you can go on to see where an ancestor lived or owned land. You will be able to get a feel for what it was like in their time and see their neighbourhood in relation to the surrounding district and terrain. Even though this was primarily an agricultural tax, family historians may be surprised to find that some tithable land existed in towns and cities of England and Wales. You may discover that the place where your Victorian ancestor lived was rural, at that time, but has now disappeared under modern suburban development.
An Example:
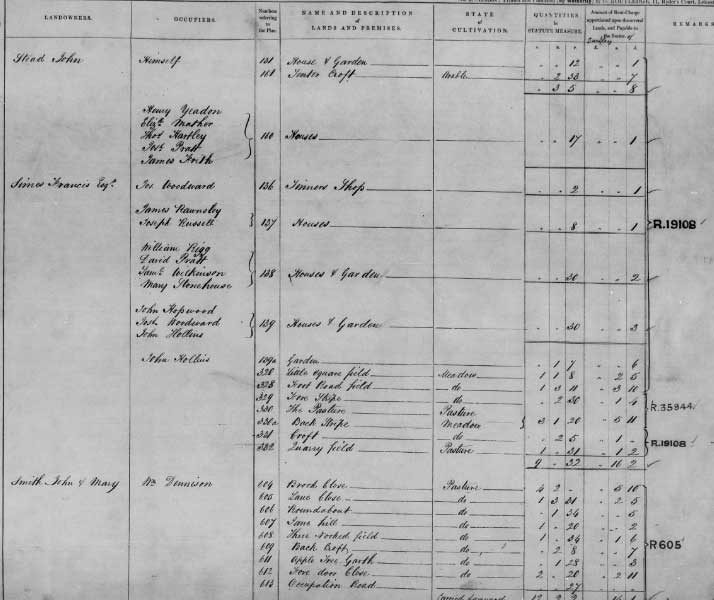
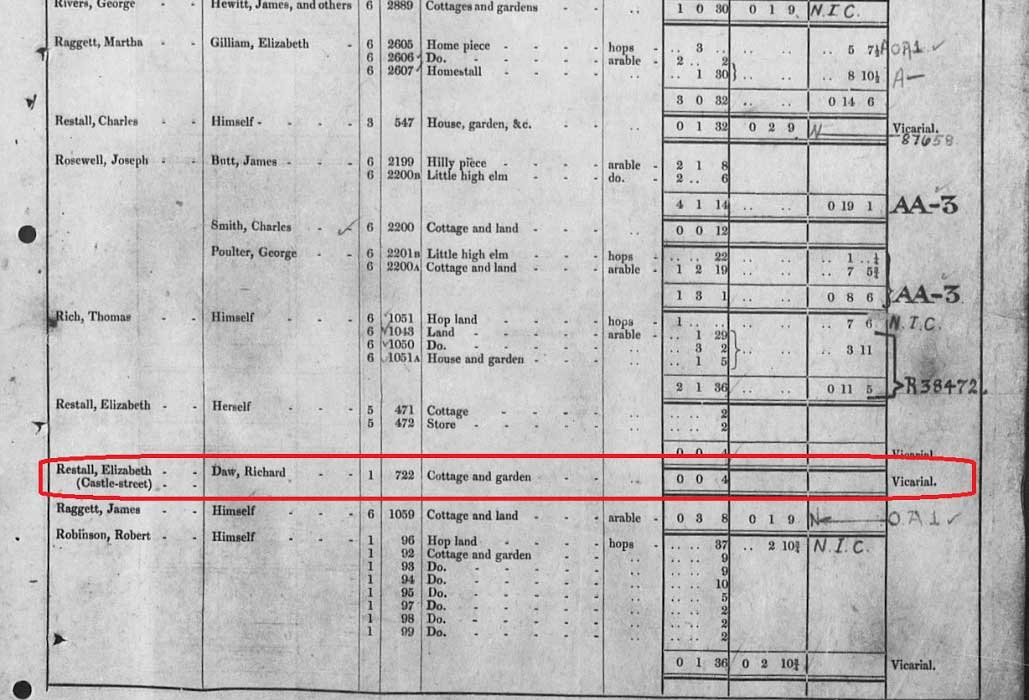
Searching for Richard Daw, an occupier of a small cottage and garden in Farnham, Surrey we can locate exactly where in the town he lived. Using the tithe apportionment book for his parish of Farnham tells us that his landlady’s name was Elizabeth Restall and that he occupied a Cottage and garden of only 4 perches in area.
The measurements are given in acres, roods and perches (imperial units). A perch is a relatively small measurement of about five and a half yards and it was often known as a ‘pole’ as its size was based on the length of the stick used to control the oxen when ploughing a field.
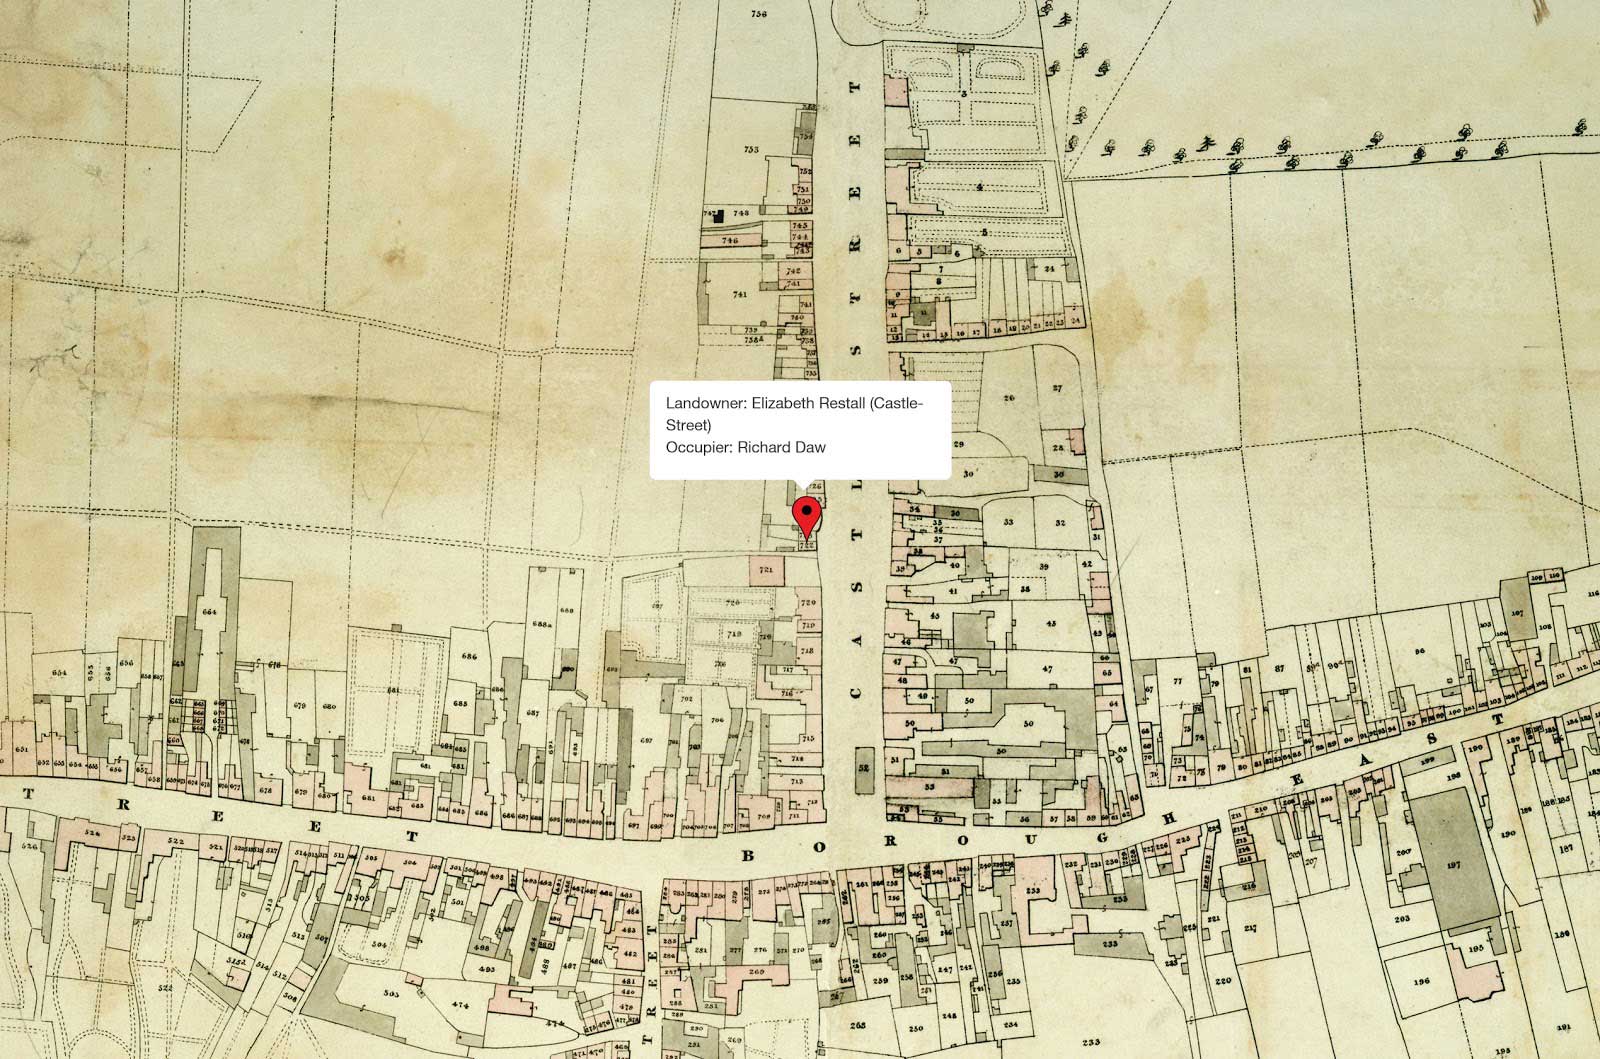
With the plot number from the schedule we can then turn to the accompanying tithe map and by searching for the annotation on the map we can see where Richard Daw’s plot was in relation to the rest of the town. Some tithe maps are in black and white while some are in colour. In this case we are able to look at one of the attractive colour maps.